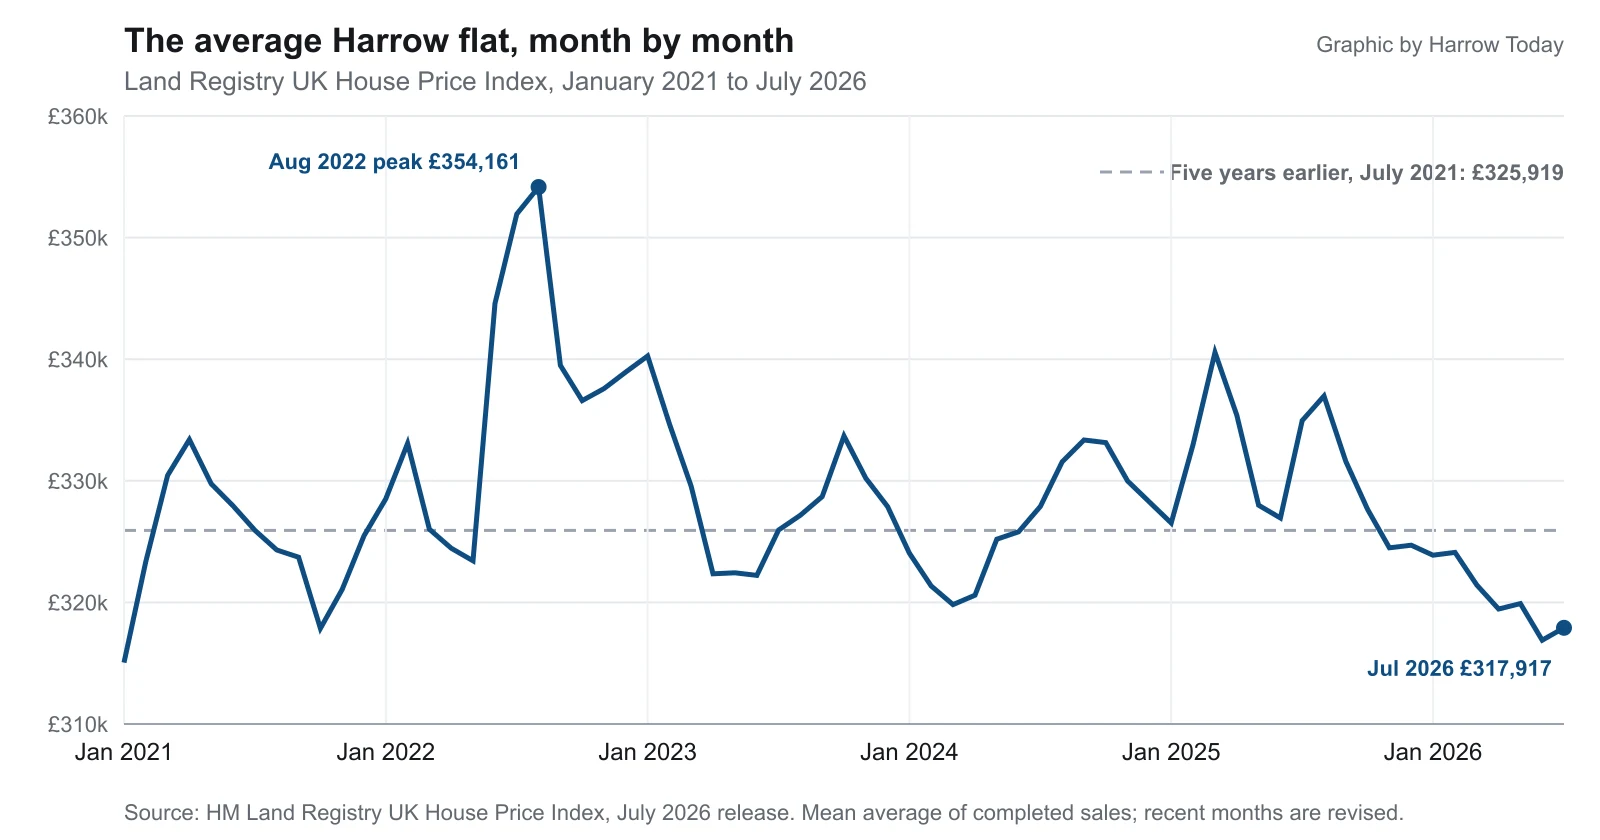

The average Harrow flat sold for £317,917 in July, £8,002 less than five years earlier. Overall prices rose 0.6% on June to £526,493, down 2.8% in a year.
A flat in Harrow sold for an average of £317,917 in July 2026. That is £8,002 less than a flat in the borough fetched five years earlier, in July 2021.
The figures come from the UK House Price Index, which HM Land Registry published on 16 September. It counts completed sales, not asking prices, and it reports a mean average rather than a median. One very expensive sale pulls the number up.
Flats are the drag on the whole borough. They fell 5.1 per cent over the year while houses of every other kind fell by less than half that.
Harrow in July, by property type
| Type | Average price | Change on a year |
|---|---|---|
| Detached | £1,206,272 | -2.4% |
| Semi-detached | £663,954 | -1.3% |
| Terraced | £536,748 | -1.3% |
| Flat or maisonette | £317,917 | -5.1% |
| First-time buyer | £433,087 | -2.9% |
| All property | £526,493 | -2.8% |
The borough average of £526,493 is £14,966 below July 2025, when it stood at £541,459. Month on month it rose 0.6 per cent.
The flat market has given back five years
Harrow flats peaked at £354,161 in August 2022. July’s figure is £36,244 below that, a fall of just over 10 per cent from the peak.
The five-year comparison is the sharper one. In July 2021 the average Harrow flat cost £325,919. It now costs £8,002 less, before any allowance for inflation.
This is not only a Harrow problem. Across the 32 London boroughs and the City of London, flat averages fell in 30 of the 33 areas in the year to July. Only Waltham Forest, Kingston upon Thames and Barking and Dagenham recorded a rise.
How Harrow compares
London as a whole averaged £550,037 in July, down 3.3 per cent on the year. Harrow’s 2.8 per cent fall was therefore slightly shallower than the capital’s.
| Area | Average price, July 2026 | Change on a year |
|---|---|---|
| Ealing | £585,216 | +0.8% |
| Hillingdon | £470,875 | -1.3% |
| Brent | £546,135 | -2.6% |
| Harrow | £526,493 | -2.8% |
| Barnet | £600,560 | -4.9% |
| London | £550,037 | -3.3% |
Twenty-one of the 33 London areas fell over the year. The steepest falls were in the central boroughs: Westminster down 20.7 per cent, the City of London down 17.4 per cent, Tower Hamlets down 14.4 per cent and Kensington and Chelsea down 14.1 per cent. Of Harrow’s neighbours, only Ealing was up.
On price rather than direction, Harrow is the 19th most expensive of the 33 areas. It sits £1,058 above Hounslow and £2,609 below Waltham Forest, in a stretch of the table where a few thousand pounds separates several boroughs.
The year in Harrow was a drift, not a drop
The borough average has moved within a band of about £22,500 over the past 12 months. It peaked at £545,695 in August 2025 and bottomed at the revised £523,168 in June 2026. Between those two points the line wanders rather than falls off a cliff, which is what the chart above shows for flats as well.
June has been revised down since we reported it
When we reported the June figures in August, the index put the Harrow average at £524,160. The July release revises June down to £523,168, a reduction of £992.
That is normal. The index restates recent months as more completed sales reach the Land Registry, and the most recent two or three months always move. It is a reason to treat any single month’s figure as provisional.
What it means for you
- If you are selling a flat, the market you are pricing into is weaker than the one for houses in the same postcode. The average terraced house in Harrow now costs £218,831 more than the average flat. Every one of the six widest gaps since January 2021 has been recorded in 2026.
- If you are a first-time buyer, the average first-time purchase in Harrow cost £433,087 in July, £13,009 less than a year earlier.
- A falling valuation does not cut your council tax. Bands are still set on what a property was worth on 1 April 1991. Our Harrow council tax bands page sets out the current charge for each band.
- These are borough-wide averages. Pinner, Stanmore and South Harrow do not move together, and the index does not publish a figure for individual wards.
Our Harrow house prices page tracks the longer series and explains how the index is put together. The August figures are due from HM Land Registry next month.
Sources
- HM Land Registry, UK House Price Index for July 2026, published 16 September 2026
- HM Land Registry, UK House Price Index, Harrow
- HM Land Registry, UK House Price Index, London
Have your say